Bitcoin Falls Sharply After Hot US PPI Data
July PPI Far Exceeds Forecasts
During Thursday morning trading in the U.S., renewed inflation concerns sent risk assets — including cryptocurrencies — sharply lower.
The Producer Price Index (PPI) for July rose 0.9%, well above the forecast of 0.2% and June’s flat reading. On a year-over-year basis, PPI increased 3.3%, surpassing expectations of 2.5% and June’s 2.4%. Core PPI (excluding food and energy) also rose 0.9%, exceeding the projected 0.2%. Core CPI on a yearly basis climbed 3.7%, above the expected 2.9% and June’s 2.6%.
Bitcoin Plunges After Hotter-Than-Expected US PPI Data
Bitcoin (BTC) tumbled from its new all-time high of $123,400 to $117,400 on Thursday after the latest US Producer Price Index (PPI) report came in much stronger than expected, shaking market sentiment.
This contrasts with Tuesday’s July CPI data (2.7%), which had boosted hopes that the Federal Reserve might cut interest rates sooner.
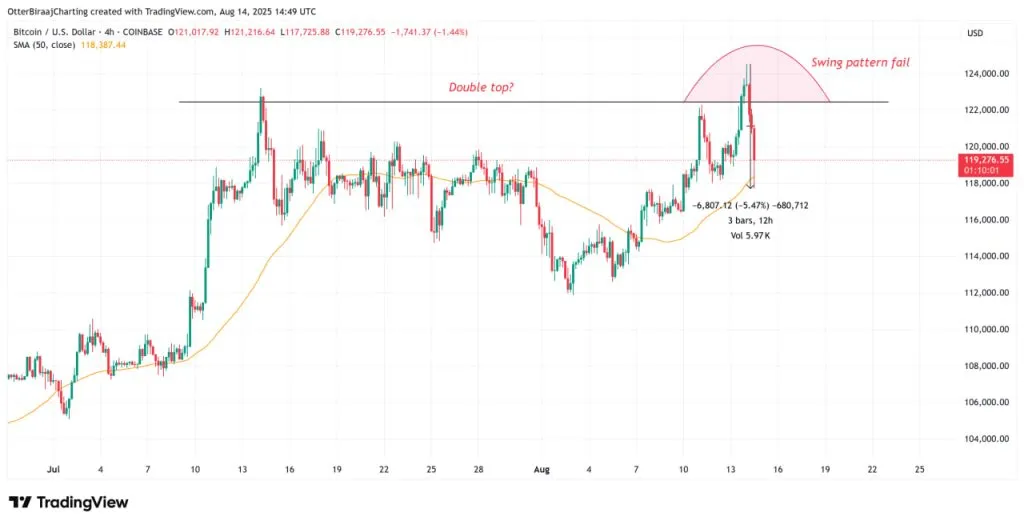
Source: TradingView
Nearly $1 billion in leveraged positions liquidated
The steep decline triggered a massive wave of liquidations, primarily from high-leverage positions. Data from Coinglass shows that almost $1 billion worth of positions were liquidated in the past 24 hours. Many short positions were “wiped out” as the price suddenly moved and reversed direction, serving as a stark reminder of the high-risk nature of leveraged trading.
Altcoins take a heavy hit
The sell-off wasn’t limited to Bitcoin. Major altcoins also came under significant pressure. Ethereum (ETH) fell over 2%, Ripple (XRP) and Solana (SOL) lost around 3%, while Dogecoin (DOGE) and Cardano (ADA) also recorded declines. This highlights the strong correlation between Bitcoin’s price movements and the overall altcoin market, where BTC volatility often triggers a chain reaction across other digital assets.
Hot PPI Could Force the Fed to Delay Rate Cuts
While the CPI report had supported a dovish outlook, the hotter-than-expected PPI has complicated the picture.
Rising producer price pressures may push the Fed to delay monetary easing, weighing on risk assets such as Bitcoin.
According to the CME FedWatch Tool, the probability of a 0.25% rate cut on September 17 remains high at 90.5% — but that’s a notable drop from 99.8% just one day earlier.
Technical Analysis: Warning Signs Before the Drop
Although the PPI data triggered the sharp sell-off, bearish technical signals had already been forming.
After BTC broke above $123,000, the market saw a bearish divergence on the RSI, indicating fading bullish momentum and potential liquidity withdrawal from the highs.
Recent leveraged trading flushed key liquidity zones between $119,000 and $117,500. After rallying over 11% in just 12 days, BTC is likely to enter a sideways consolidation phase to cool off before the next move.
- Bullish scenario: A decisive 4-hour close above $120,000 would confirm upside continuation.
- Bearish scenario: The odds of revisiting levels below $117,000 are rising, especially with a double-top pattern emerging on the 3-day chart — the same structure that triggered a steep drop to $75,000 in Q1 2025.
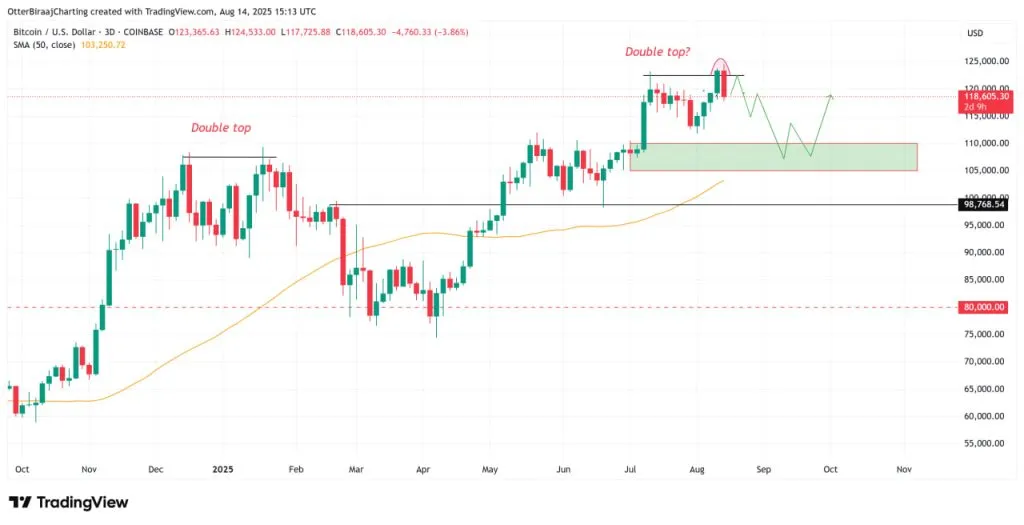
Source: TradingView
Disclaimer: The content above reflects the author’s personal views and does not represent any official position of Cobic News. The information provided is for informational purposes only and should not be considered as investment advice from Cobic News.