Key Q4 Indicators: Bitcoin, XRP, Dollar, Nvidia
Introduction: Why Q4 could reshape the market
The last quarter of the year often brings decisive moves for global markets. For crypto investors, Q4 2025 is especially critical because historical trends and technical signals align with macroeconomic shifts. Understanding these indicators may help traders anticipate volatility and capture opportunities before year-end.
Bitcoin and Ethereum: Seasonal momentum
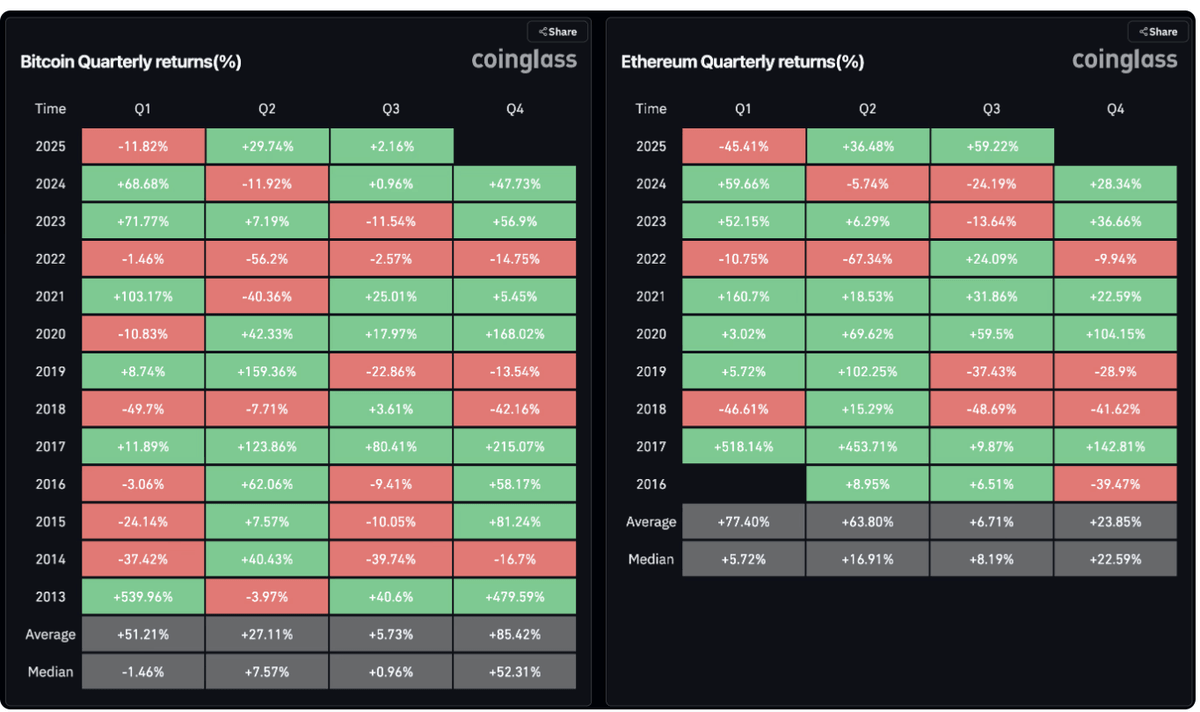
Source: coinglass.com
Historically, Bitcoin’s strongest performance has come in the final quarter. Since 2013, Bitcoin has averaged an 85% gain in Q4, with November standing out as the most profitable month. October often sets the stage with steady upward momentum, creating a launchpad for year-end rallies.
Ethereum also benefits from seasonal strength, but its peak performance tends to occur in Q1. Still, Q4 frequently delivers positive returns for ETH, aligning with Bitcoin’s bullish environment.
The 50-Week SMA: A critical line for Bitcoin
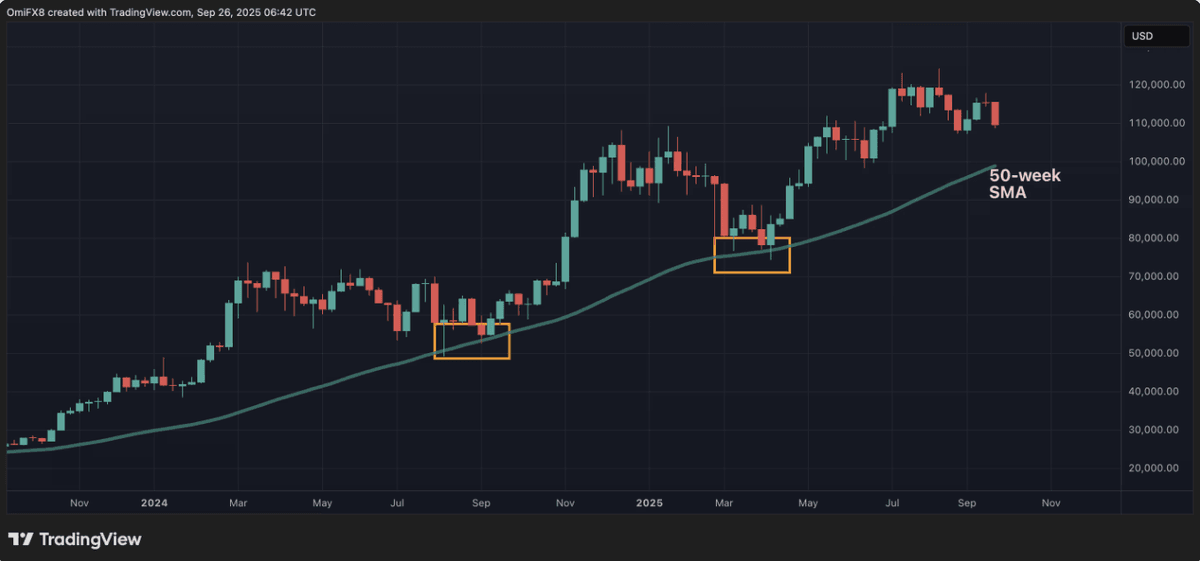
Source: tradingview.com
The 50-week simple moving average (SMA) has consistently served as a key support level in Bitcoin’s long-term cycles. Currently, it sits near $98,900. Holding above this level would confirm strength in the ongoing bull cycle.
If Bitcoin falls below, however, attention may shift to the 200-day SMA around $104,200. This zone could determine whether the market consolidates or transitions into a deeper correction.
XRP/BTC: Preparing for a breakout
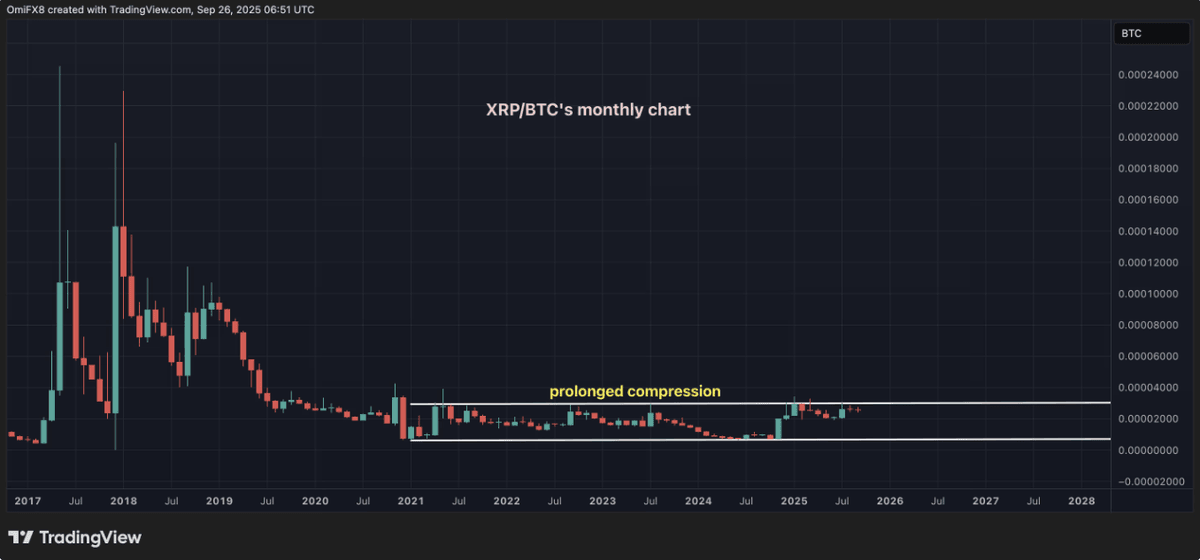
Source: tradingview.com
The XRP/BTC trading pair has been compressed in a multi-year sideways range for over four years. Extended consolidations often precede explosive moves, and current price action suggests buyers are gaining momentum.
A confirmed breakout could signal renewed interest in altcoins, with XRP leading relative strength against Bitcoin. Traders should monitor volume and weekly closes to assess if the breakout is sustainable.
Leveraged ETF signals: SMST’s inverse formation
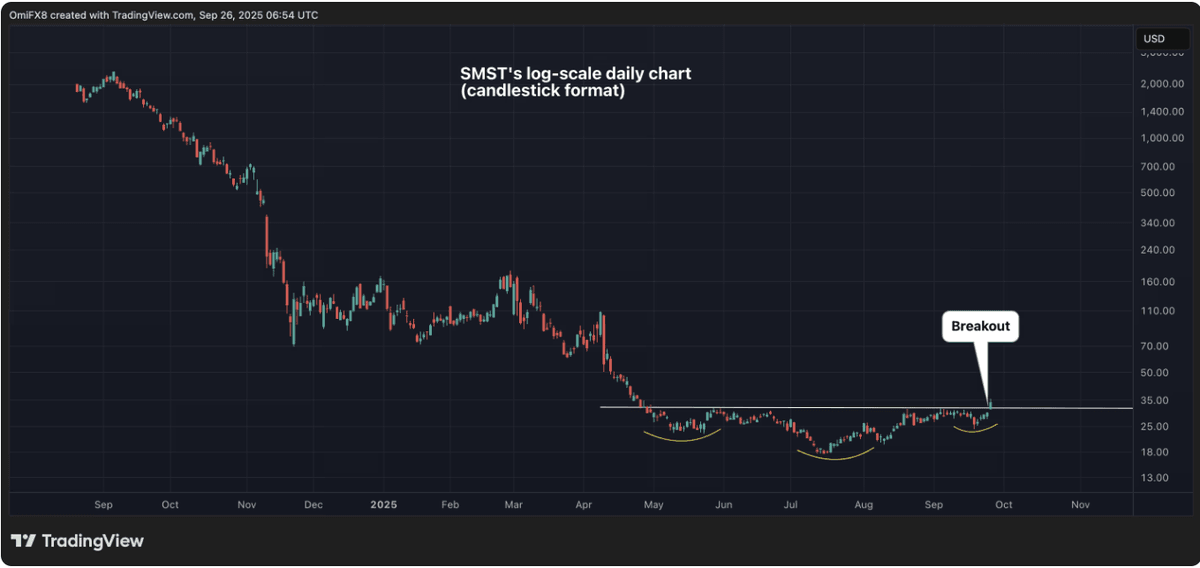
Source: tradingview.com
The Defiance Daily Target 2× Short MSTR ETF (SMST) is displaying an inverse head-and-shoulders pattern, often a bullish reversal signal. Since SMST tracks leveraged short exposure to MicroStrategy, its reversal could indirectly point to waning bearish pressure on Bitcoin.
This indicator is worth following because sentiment shifts in crypto-equity ETFs often foreshadow market direction in the underlying digital assets.
Dollar Index (DXY): Testing a double bottom
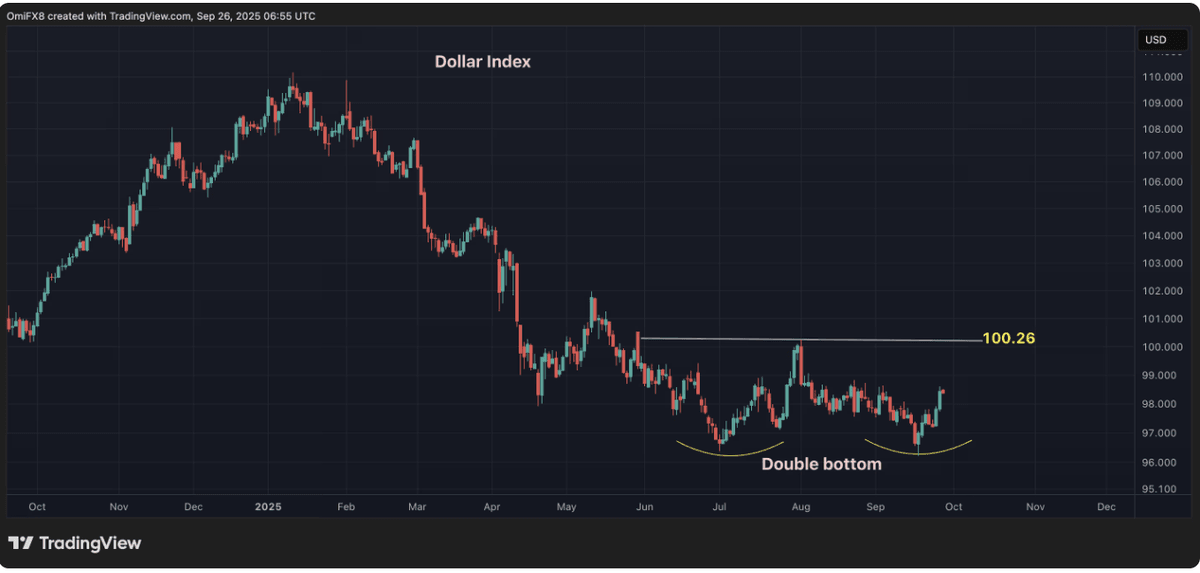
Source: tradingview.com
The U.S. Dollar Index (DXY) has carved a double bottom near 96.30, suggesting buyers are regaining strength. If DXY rises above 100.26, the formation would be confirmed, opening room toward 104.00.
A strong dollar typically weighs on risk assets like crypto. Conversely, if DXY weakens below 96.00, risk markets, including Bitcoin and Ethereum, could see significant relief rallies.
Nvidia: A bellwether for risk appetite
Nvidia (NVDA) has been one of the most influential stocks in 2025 due to its dominance in AI and tech sectors. Currently, it is testing resistance at the top of a broadening channel.
If Nvidia fails to break higher, it could mark a slowdown in tech momentum, dampening investor risk appetite across equities and spilling over into crypto. If NVDA rallies through resistance, however, it could reignite enthusiasm for risk assets into Q4.
Strategic outlook for Q4 2025
Traders and investors should monitor the following:
• Bitcoin’s seasonal strength supports bullish momentum.
• 50-week SMA near $98,900 is the most important technical support.
• XRP/BTC breakout could highlight altcoin dominance.
• SMST ETF patterns may hint at Bitcoin sentiment shifts.
• Dollar index trajectory will influence capital flows.
• Nvidia’s resistance test could act as a broader risk signal.
Combined, these indicators offer a roadmap for navigating the final quarter of 2025 with clearer expectations and strategies.
Disclaimer: This article is intended solely to provide information and market insights at the time of publication. We make no promises or guarantees regarding performance, returns, or the absolute accuracy of the data. All investment decisions are the sole responsibility of the reader.