
Bitcoin Breaks 200WMA – Strong Bull Run Signal
Bitcoin breaks above 200WMA – A key bullish signal
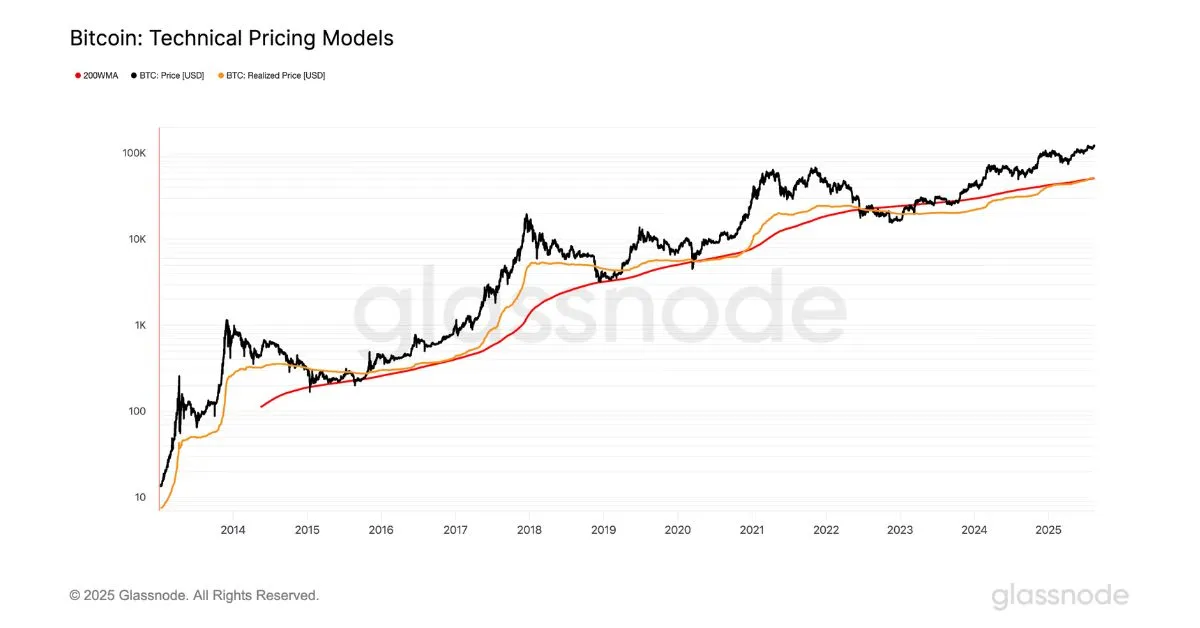
On August 14, 2025, Bitcoin’s realized price officially crossed above the 200-week moving average (200WMA), a long-term market health indicator closely watched by analysts. Historically, whenever Bitcoin’s realized price has broken above this level, the market has often entered a period of strong bull runs with significant gains.
Technical patterns point to more upside
The current Bitcoin price chart is showing two key bullish patterns: an Inverse Head and Shoulders, which signals a potential trend reversal to the upside, and a Bull Flag, which indicates a continuation of the current bullish momentum. If these patterns fully develop, Bitcoin could potentially rally toward the $150,000 mark in the coming months.
On-Chain data supports the bullish case
On-chain metrics reveal that Bitcoin’s exchange supply has dropped to its lowest level in seven years, while the percentage of long-term holders (HODLers) remains high. This indicates that most investors are not looking to sell, reducing selling pressure and creating favorable conditions for sustained price appreciation.
Takeaways for investors
For long-term investors, this breakout above the 200WMA is a highly positive signal, suggesting the start of a new bullish cycle. However, in the short term, it remains important to monitor price volatility and macroeconomic indicators, particularly U.S. CPI reports. Combining technical analysis with on-chain insights can help make more informed trading decisions while minimizing risks.