What is a Trendline? Guide to Drawing and Using Trendlines in Effective Trading
1. What is a Trendline?
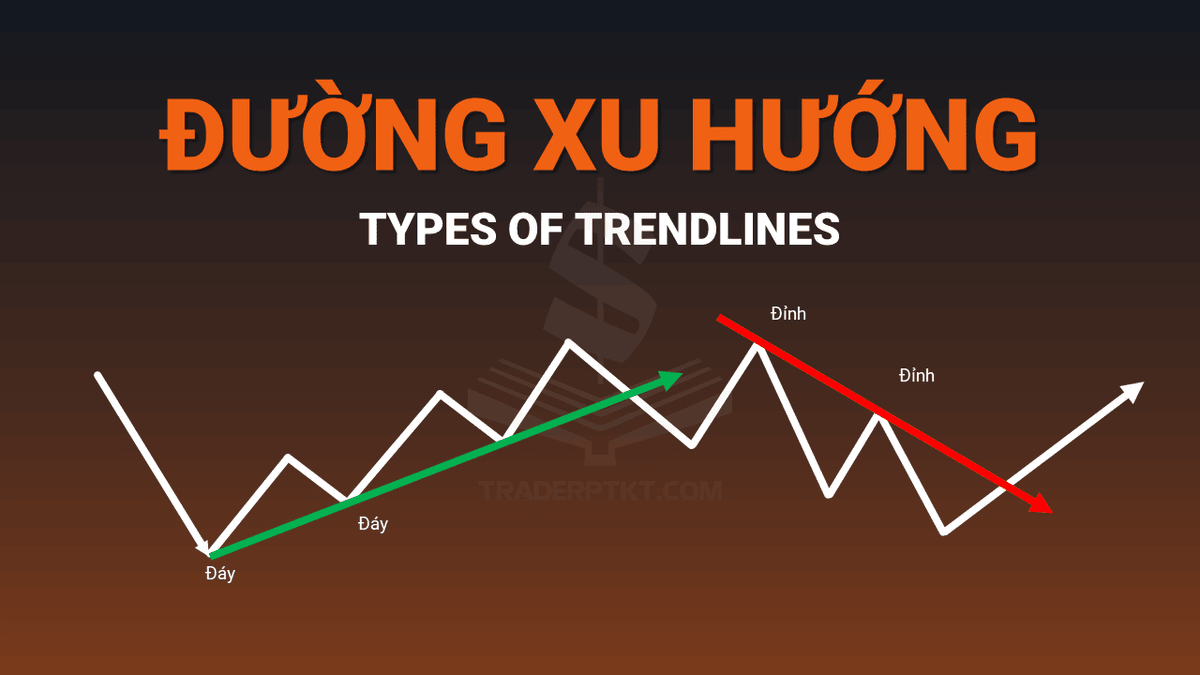
A Trendline is a straight line that helps traders identify the future price trend of the market more easily and clearly. Trends can be upward, downward, or sideways.
Uptrend: Trendline connects the lows and acts as a support line.
Downtrend: Trendline connects the highs and acts as a resistance line.
Sideways trend: Trendline forms two parallel lines representing support and resistance.
2. How to Draw a Trendline
Identify at least two high or low points on the price chart.
Draw a straight line connecting these points, ensuring it passes through as many highs/lows as possible.
The line can be drawn through the candle bodies or wicks, depending on trading style.
3. Using Trendlines in Trading
Identifying trends: Trendlines help recognize the current market trend.
Trading signals: A break of the Trendline may indicate a trend reversal.
Combining with other indicators: Use alongside RSI, MACD, Fibonacci for increased accuracy.
4. Notes on Using Trendlines
Trendlines represent a price zone, not a specific price point.
Avoid trading against the main trend to minimize risk.
Always set a stop-loss when trading with Trendlines to protect capital.