What Is Time Frame? How To Choose The Right Crypto Chart Frame
1. What is a Time Frame in Trading?
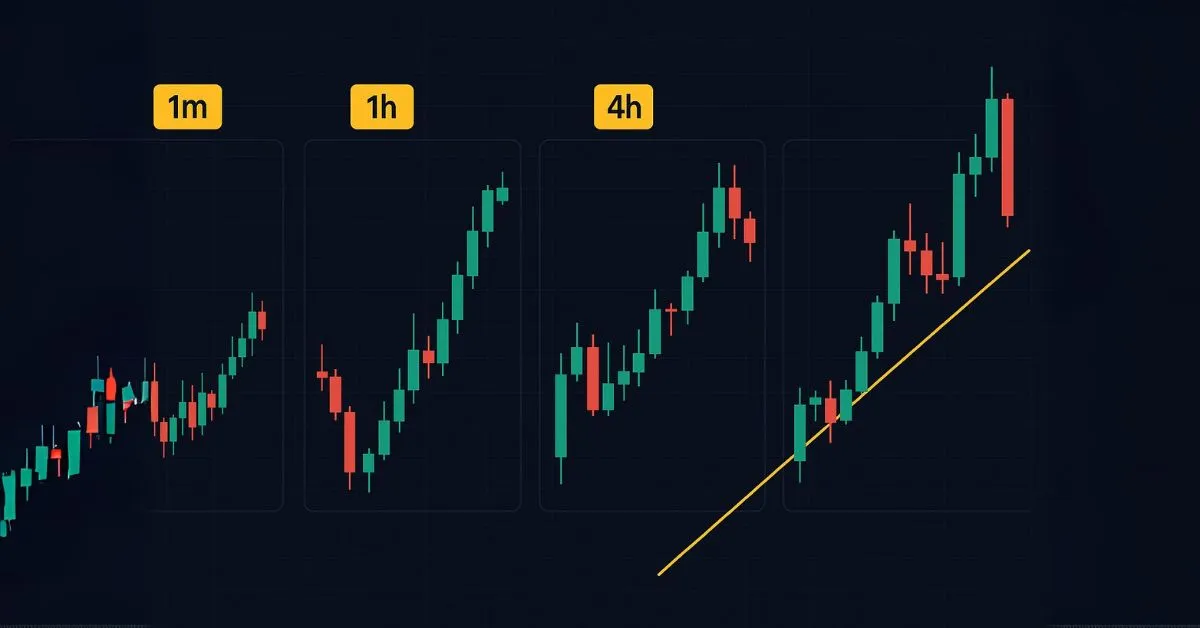
A Time Frame refers to the duration each candlestick on a price chart represents. For example, a 1-minute chart shows how price moves every minute, while a 1-day chart represents price movements over an entire day.
2. Common Types of Time Frames
• Short-term (1m, 5m, 15m, 30m, 1H): Ideal for scalpers and day traders.
• Medium-term (4H, 1D): Best suited for swing traders or short-term holders.
• Long-term (1W, 1M): Suitable for long-term investors and trend analysis.
3. Pros and Cons of Each Time Frame
| Time Frame | Pros | Cons |
|---|---|---|
| Short-term | More trading opportunities | High noise, requires close monitoring |
| Medium-term | Balanced risk and reward | Can be affected by short-term volatility |
| Long-term | Clear trend identification | Fewer trades, requires patience |
4. How to Choose the Right Time Frame
Your ideal Time Frame depends on:
• The amount of time you can spend trading daily
• Your risk tolerance
• Your trading strategy: scalping, day trading, swing trading, or long-term investing
5. Using Multiple Time Frames for Better Results
• A powerful method is to use multi-timeframe analysis:
• Use higher Time Frames (Daily, Weekly) to define the trend
• Use lower Time Frames (15m, 1H) to identify precise entry points