What Is RSI? How To Use RSI Effectively In Crypto Trading
1. What Is The RSI Indicator?
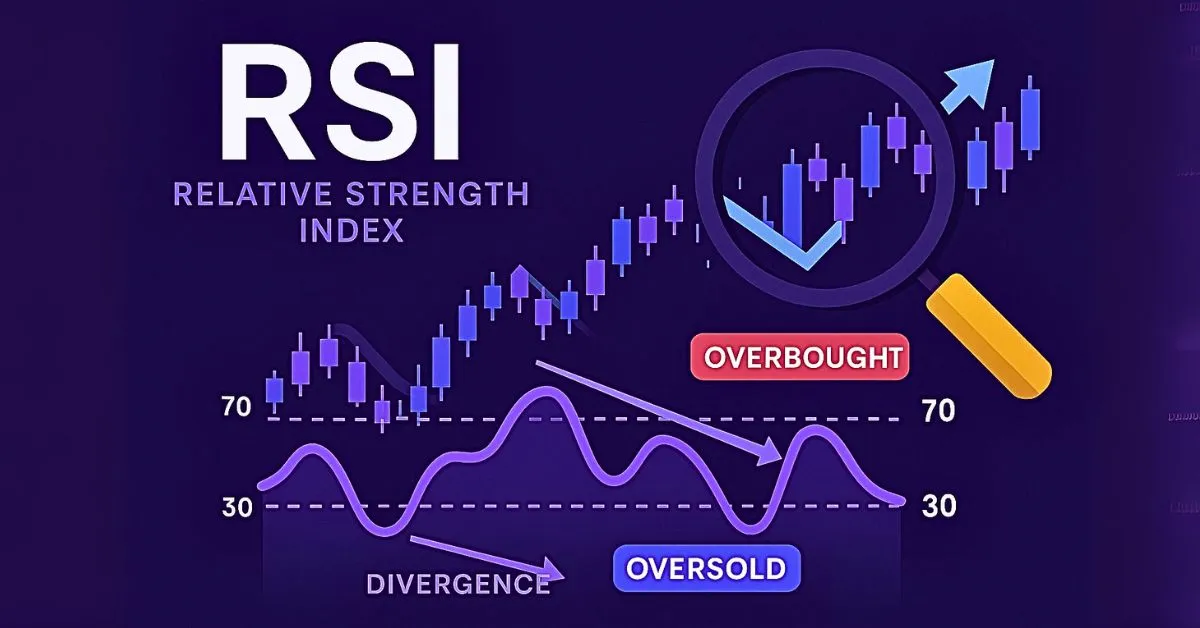
The RSI (Relative Strength Index) is a momentum indicator that measures the speed and change of price movements, helping identify overbought or oversold market conditions. The indicator oscillates between 0 and 100.
2. Calculation Formula
The RSI is calculated using the following formula:
RSI = 100 - [100 / (1 + RS)]
Where:
• RS (Relative Strength) = Average Gain / Average Loss
• Typically, the RSI is calculated over a 14-period timeframe.
3. How To Set Up The RSI Indicator On A Chart
To add the RSI indicator to your trading chart:
- Select the indicator option on your trading platform.
- Search for "RSI" and add it to your chart.
- Adjust the parameters (period, overbought/oversold levels) as needed for your analysis.
Common RSI levels used:
- Above 70: The market may be overbought.
- Below 30: The market may be oversold.
4. How To Use RSI In Crypto Trading
• Identify Buy/Sell Points: An RSI above 70 may indicate a selling opportunity; below 30 may indicate a buying opportunity.
• RSI Divergence: When price and RSI move in opposite directions, it may signal a trend reversal.
• Combine with Other Indicators: Use RSI alongside indicators like MACD, Bollinger Bands to confirm signals.
5. Considerations When Using RSI
• RSI may produce false signals in sideways markets.
• It is advisable to combine it with other technical analysis tools for signal confirmation.
• Adjust RSI parameters to suit different assets and trading timeframes.