What Is an Indicator? Top 7 Technical Analysis Tools Explained
1. What Is an Indicator?
An indicator is a technical analysis tool used by crypto traders to evaluate market trends and identify potential entry and exit points. Indicators are calculated based on historical price and volume data, helping investors make more objective decisions in volatile cryptocurrency markets.
2. Types Of Technical Indicators
Technical indicators are generally divided into two main categories:
Leading Indicators: These predict potential future market trends and are useful for identifying early trend reversals in crypto trading.
Lagging Indicators: These confirm existing trends, helping traders build confidence before making a move.
3. Top 7 Most Popular Technical Indicators In Crypto Trading
Below are 7 essential crypto trading indicators widely used by professional and retail traders:
• Moving Average (MA)
A lagging indicator that smooths out price data over time, helping traders identify the overall market direction.
• Relative Strength Index (RSI)
A leading indicator that measures the speed and change of price movements, helping identify overbought or oversold conditions.
• MACD (Moving Average Convergence Divergence)
Combines both leading and lagging signals by analyzing the relationship between two EMAs to identify buy or sell opportunities.
• Bollinger Bands
A lagging indicator that reflects market volatility and helps traders spot potential support and resistance levels.
• Money Flow Index (MFI)
A volume-weighted leading indicator that shows the strength of money flowing in or out of a cryptocurrency asset.
• Volume
Volume is a key lagging indicator that confirms the strength of price movements and trend reliability.
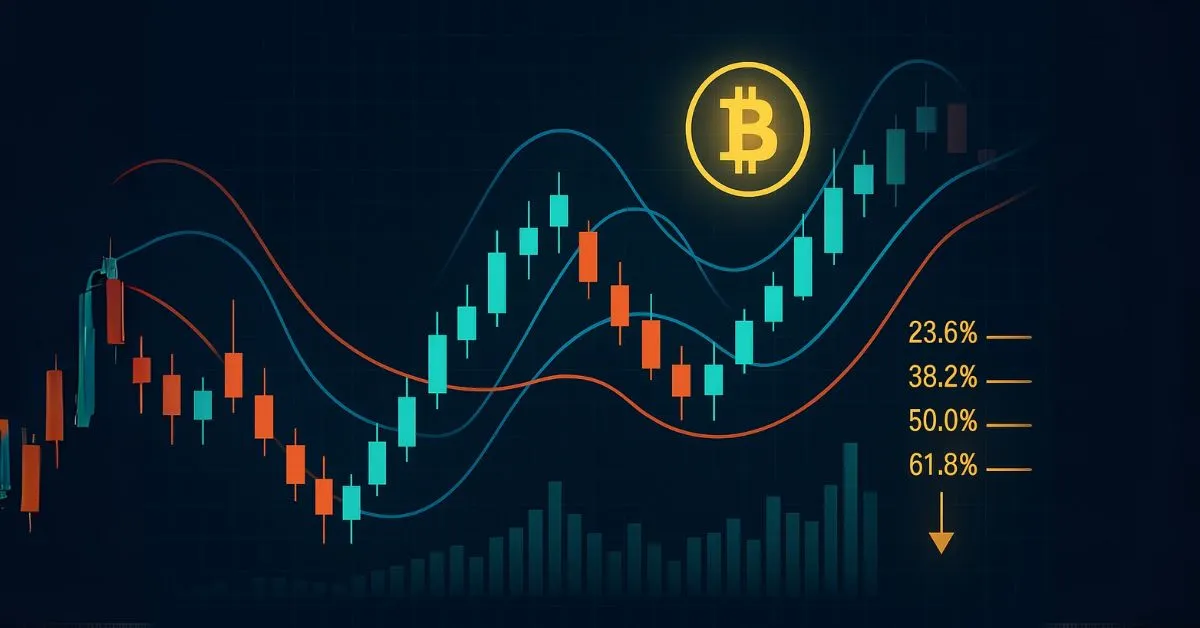
• Fibonacci Retracement
A popular tool used to identify potential support and resistance levels based on Fibonacci ratios during trend corrections.
4. Pros And Cons Of Using Indicators In Crypto Trading
Pros:
Assist in identifying market trends and precise entry/exit points.
Improve risk management strategies.
Can be applied across different timeframes and asset classes.
Cons:
May generate false signals in highly volatile markets.
Do not account for fundamental factors like news, macroeconomic events, or investor sentiment.
5. Conclusion
Mastering the use of crypto trading indicators is essential for improving decision-making and minimizing risk. However, traders should use a combination of indicators and never rely on a single one. Always back up your analysis with solid risk management and stay updated on market developments.