What Is MACD? How To Trade Crypto Using MACD Indicator
1. What Is MACD?
MACD (Moving Average Convergence Divergence) is a popular technical indicator designed to reveal the strength, direction, and momentum of a price trend. Developed by Gerald Appel in the late 1970s, MACD helps traders spot buy and sell signals based on the convergence and divergence of moving averages.
2. Components Of MACD
The MACD consists of three key elements:
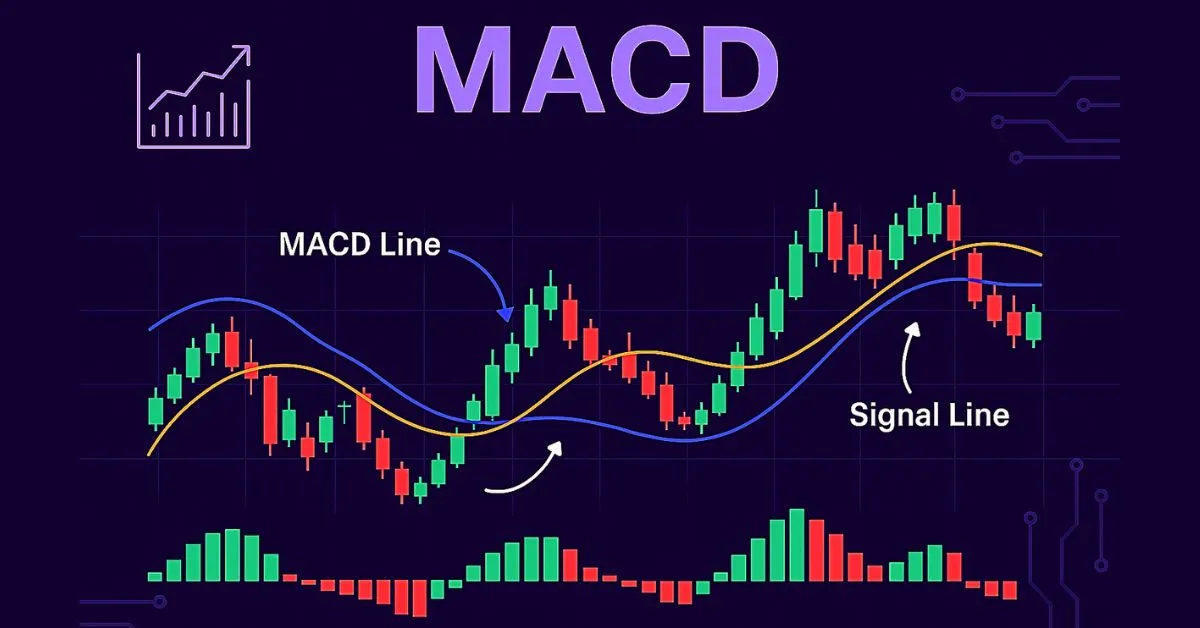
• MACD Line: The difference between the 12-day EMA and 26-day EMA.
• Signal Line: A 9-day EMA of the MACD Line.
• Histogram: Represents the gap between the MACD Line and Signal Line.
3. How To Use MACD
- MACD offers various trading signals:
• Crossovers between MACD and Signal Line:
° MACD crossing above Signal Line ⇒ buy signal.
° MACD crossing below Signal Line ⇒ sell signal.
• Zero Line Crossover:
° MACD > 0 ⇒ bullish trend.
° MACD < 0 ⇒ bearish trend.
• MACD Divergence:
° Price rises while MACD falls ⇒ bearish reversal.
° Price drops while MACD rises ⇒ bullish reversal.
4. Pros And Cons Of MACD
Pros:
• Easy to understand and apply.
• Suitable for all timeframes.
• Works well in trending markets.
Cons:
• Less reliable in sideways markets.
• May lag during trend reversals.
5. Trading Strategies With MACD
• MACD + RSI Combo: Improves signal accuracy.
• MACD with Support/Resistance: Enhances entry/exit timing.
• MACD Divergence Trades: Capitalize on potential market reversals.
6. Conclusion
MACD is a versatile and reliable indicator for trend analysis and signal confirmation. For optimal results, it's best used in conjunction with other technical tools to reduce false signals and enhance trading performance.