Japanese Candlestick Patterns in Crypto: How to Read & Apply
1. What Are Japanese Candlestick Patterns?
Japanese Candlestick Patterns are a visual method of representing the price movement of an asset, especially popular in Crypto technical analysis. Each candlestick provides four key data points: the opening price, closing price, highest price, and lowest price within a specific time frame.
2. Structure Of A Japanese Candlestick
- Body: The distance between the opening and closing prices.
- Wick/Shadow: The upper and lower parts of the candlestick, indicating the highest and lowest prices.
- Candle Color:
• Green / White: Closing price > Opening price ⇒ uptrend
• Red / Black: Closing price < Opening price ⇒ downtrend
Candlestick patterns help Crypto investors better understand market sentiment and trading behavior.
3. Popular Reversal Candlestick Patterns
These patterns often appear at the top or bottom of a trend and signal a potential reversal:
• Hammer & Hanging Man
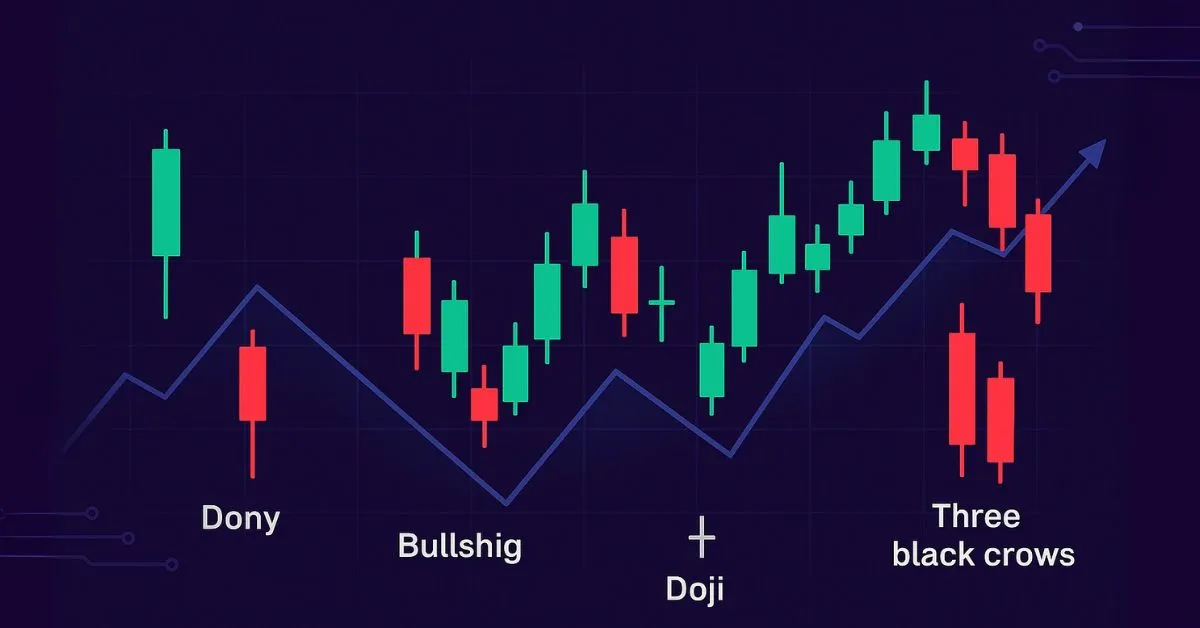
• Doji – Signal of market indecision
• Engulfing Pattern – Strong reversal signal
• Morning Star / Evening Star – A reliable three-candle reversal setup
4. Trend Continuation Candlestick Patterns
• Three White Soldiers / Three Black Crows: Indicate a strong trend continuation.
• Rising / Falling Three Methods: Confirm the ongoing trend in the highly volatile crypto market.
5. How To Use Candlestick Patterns In Crypto Trading
• Combine With Support and Resistance Zones: Helps identify optimal entry and exit points.
• Confirm Signals With Other Indicators: Such as RSI or MACD for better accuracy.
• Do Not Trade Based on Single Candles Alone: Use candlestick patterns with other technical analysis tools to minimize risk.
6. Conclusion
Understanding and using Japanese candlestick patterns is a foundational skill for traders to identify trends, reversal points, and optimize Crypto trading strategies. Combining candlestick analysis with other indicators will help you trade more accurately and effectively in the volatile cryptocurrency market.