Bull Flag Pattern In Crypto: Identification And Effective
1. What Is A Bull Flag Pattern?
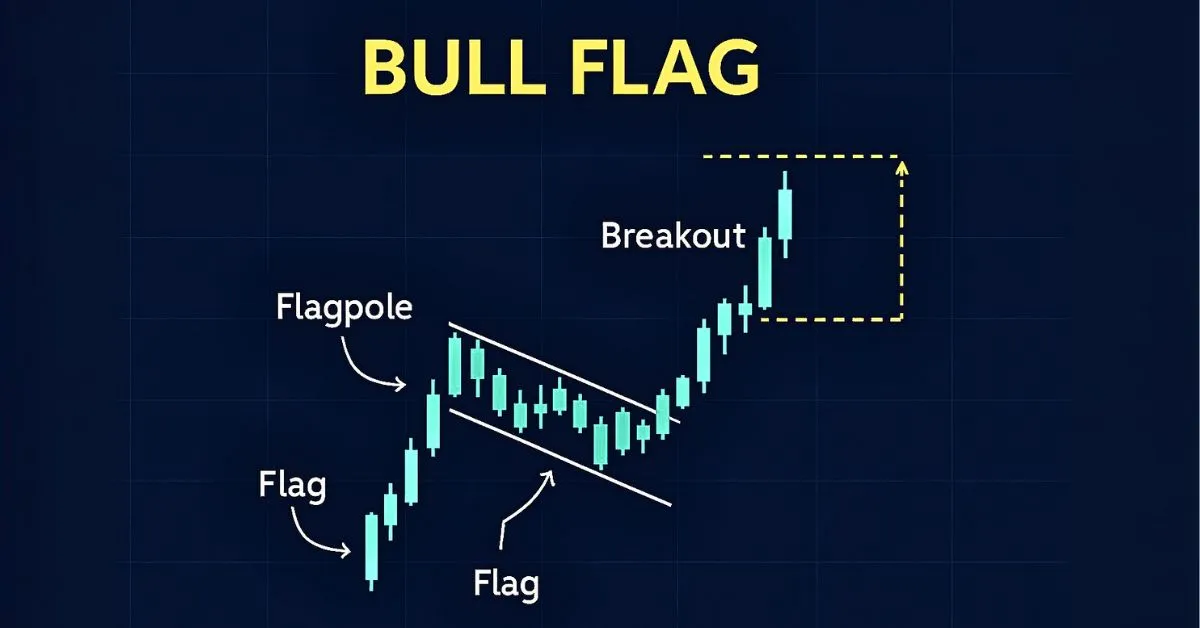
A Bull Flag is a chart pattern signaling the continuation of an uptrend after a short-term consolidation. The pattern resembles a flag on a pole, with the flagpole representing a sharp price increase and the flag indicating a brief period of consolidation.
2. Structure Of The Bull Flag Pattern
• Flagpole: Represents a strong upward price movement, typically consisting of consecutive long green candlesticks, indicating robust buying pressure.
• Flag: After the sharp rise, the market consolidates in a narrow range, forming a flag-like pattern that may slightly slope downward or move sideways.
• Breakout: When the price breaks above the upper boundary of the flag with increased volume, it signals the continuation of the uptrend, presenting a potential buying opportunity.
3. Trading Strategies Using The Bull Flag Pattern
• Identifying the Pattern: Utilize technical indicators such as Moving Averages and the Relative Strength Index (RSI) to detect the flagpole. Monitor the subsequent consolidation phase forming the flag.
• Entry Point: Enter a long position when the price breaks out above the flag's resistance level, accompanied by a surge in trading volume.
• Stop-Loss: Place a stop-loss order just below the lower boundary of the flag to protect against unexpected price reversals.
• Take-Profit: Set a profit target by measuring the height of the flagpole and projecting it upward from the breakout point.